
A data-driven organization is only as successful as the ability of its employees to understand and act on the data. That’s why we’d argue that designing successful data applications requires a multi-faceted approach- one that sees business objectives, data systems, and business users as being intimately connected and mutually impactful.
Our design process addresses this idea in three parts: Research, Ideate, and Evaluate. We’ll talk more in-depth on ideating and evaluating data applications in later posts of this mini-series, but for now, let’s talk about a few methods and tools you can use to collect all the information necessary to design an effective and impactful solution. Let’s talk RESEARCH!
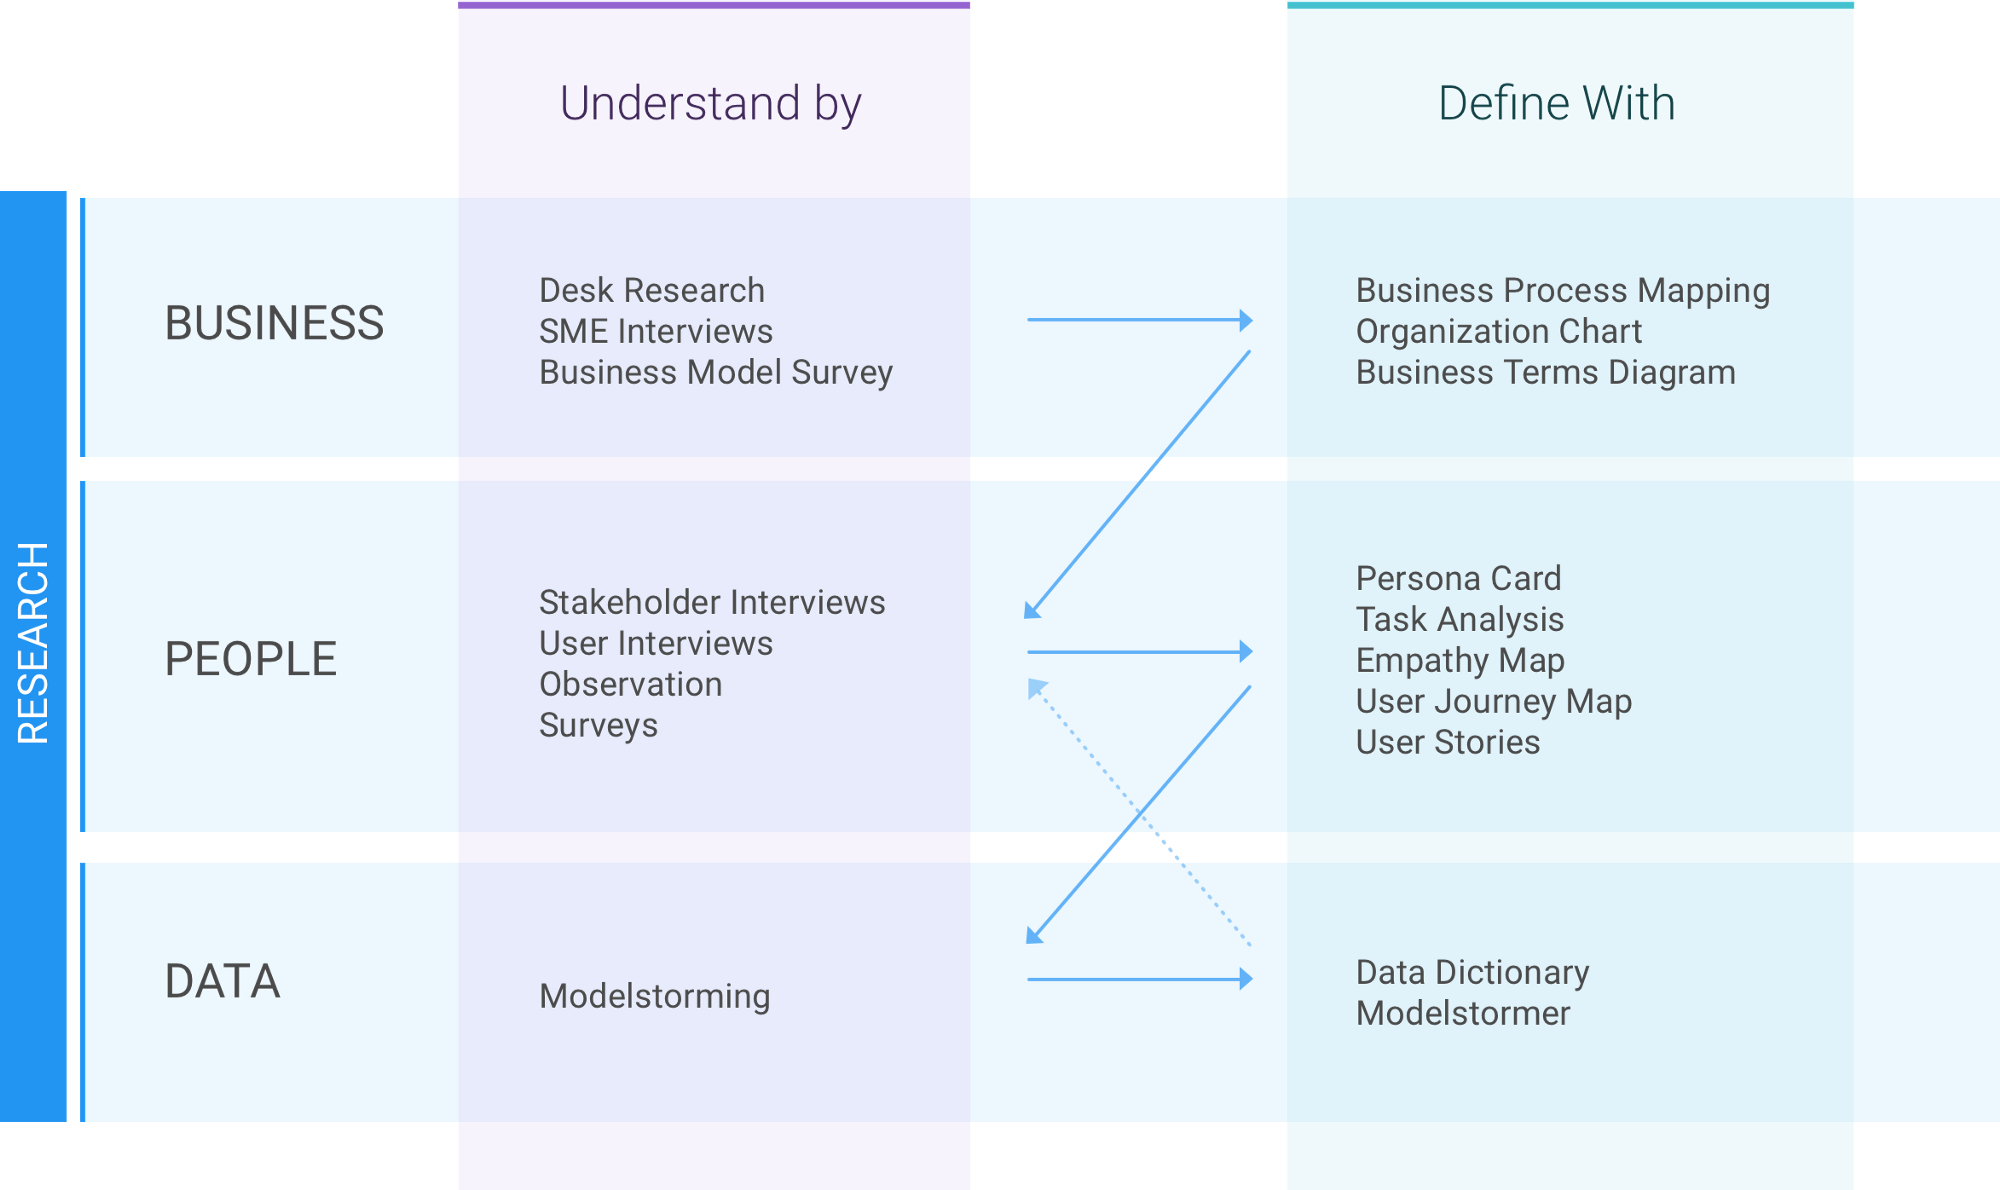
The Research phase involves three different areas of focus: the overall business context, the users’ tasks and needs, and the feasibility & availability of the data. It is at the intersection of all three of these areas that we work to design, so that we can develop applications that are not only user-centered and business-focused, but can also work within the constraints of the data and technology.
First, what’s the business context?
Understanding the business context before interviewing users is like familiarizing yourself with a country’s language before visiting it. Don’t we all want to stop asking locals “what’s the word for bathroom again?” and start asking more meaningful and sophisticated questions? When you can first understand how the business works and the meaning behind specific business terms, you can move away from questions like “what does that word mean?” to “why is that important to you?” The focus shifts to how the user works, rather than how the business works.
It also enables you to have a more holistic understanding of how the user fits into the larger picture. This can equip you to ask more informed questions about how a user might interact with another business domain, where the user sees him/herself fitting in a specific business process, and so on. For instance, if you were working to understand the business context of a healthcare organization, you might find yourself coming to appreciate how this data impacts users that are one or two degrees away from the data application, like patients and their families. This appreciation could end up informing certain decisions in your design, such as choosing to prioritize data quality and security. Rather than retroactively picking up on the business process after all the user interviews are over, you’re able to collaboratively work with the user to understand specific goals and needs.
The main questions we try to answer in this first focus area are:
- What type of business is it (retail, manufacturing, utility, insurance, etc.)?
- How does this type of business, and this specific client, work? For example, what’s their value proposition? What are the core activities? Who are their customers? What’s their revenue stream? Which actors, both internal and external, are key to this business?
- Which business function is in scope?
- How does this business function work in general? For example, what are its success factors? How are they typically measured (common KPIs)? What user roles are typically involved? What do they do? What are the key activities?
You can collect this information by reading up on financial reports (10k, annual report, 10Q report, etc.), using public sources of information like LinkedIn, and having an interview with a business SME (ideally on the client side). We always recommend synthesizing the learned information in some sort of artifact, since that’ll be an easy way to not only bring others up to speed, but to also reference during user interviews. A few things our team has put together in the past are org charts, business terms diagrams (example below), and business process maps.
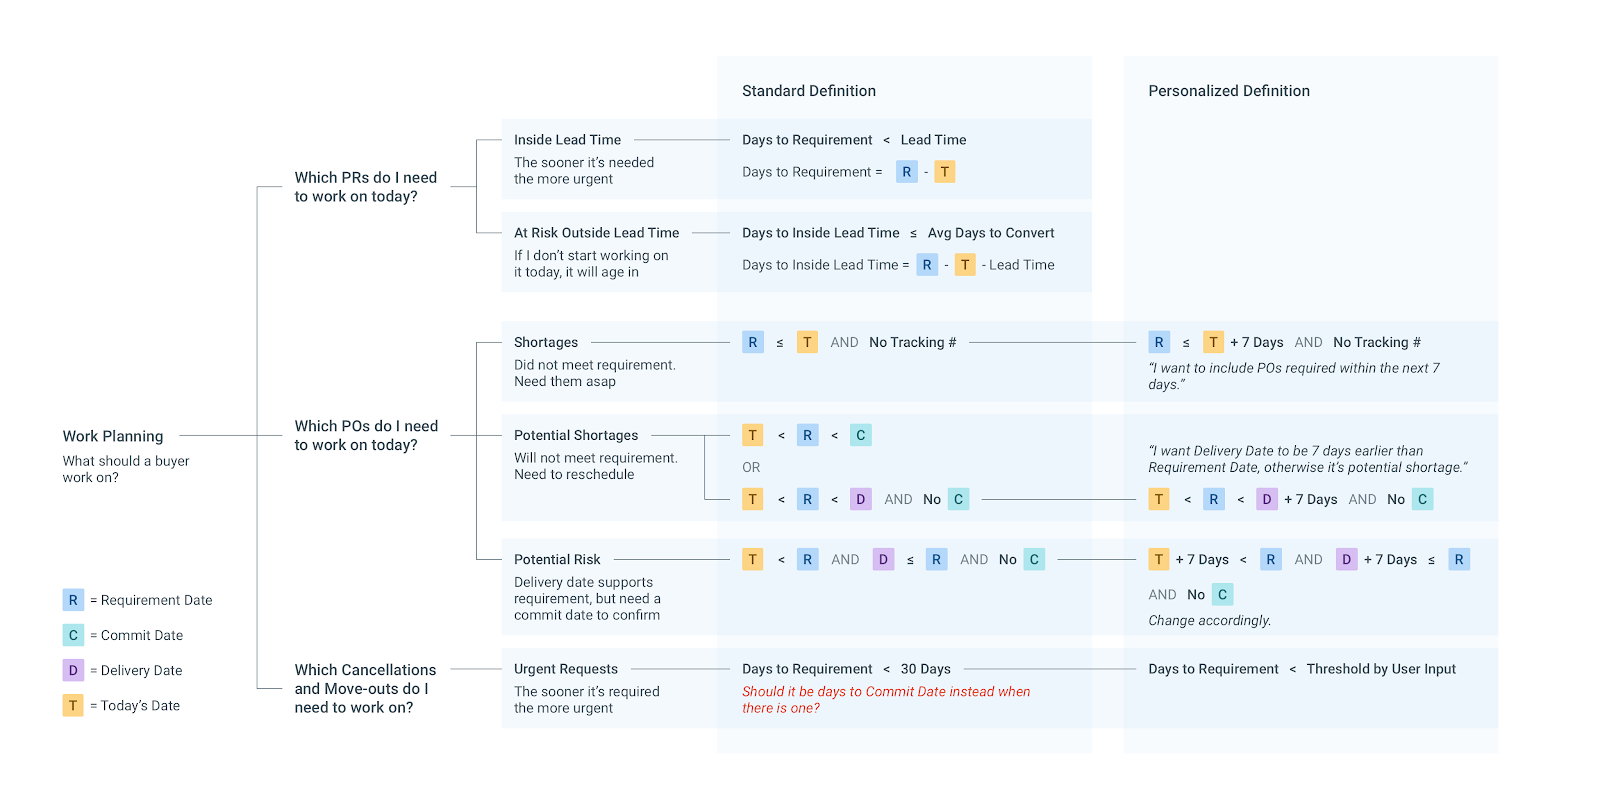
An example of a business terms diagram that maps out the meaning of specific dates in the context of larger business questions
Okay, so what do the users want?
Now, we move toward understanding the users — the people who are using data to execute business vision. It’s important to listen to their stories and uncover the “why” behind their requests, needs, and problems, because that’s what’ll drive the purpose and format of the data so that it’s actually actionable. And it’s not enough to simply work off a list of metrics that someone requested. We’ve outlined a few reasons here, but the crux of of it is that understanding the users behind the data leads to visualizations that are intentionally traced to a specific user task or pain point. Otherwise, they’re just numbers.
We first Interview & Survey users to understand the goals, tasks, and pain points of their processes. User interviews, surveys/questionnaires, and the Five Why’s are methods that can provide a decently clear picture of what the users are trying to accomplish everyday, what their success criteria are, and what frustrates them about the current process.
Tips for Interviews:
- Understand and communicate the goal of the interview.
- Don’t just plainly ask your users what they’d like to see. Instead, use the Five Why’s to uncover bigger goals around a users’ daily tasks.
- Understand the context within which the user is working. For instance, what inputs trigger certain actions, and what outputs are expected of them? What external events might change or influence their behavior and attitude?
- Be as comprehensive as possible when capturing information about their workflow. For instance, what questions are they trying to answer, and how frequently? How does data help them answer those questions?
Tips for Surveys:
- Use language that’s easy to understand
- Order the questions to have some logical flow
- Use a neutral tone that will not bias the user
- Front load the most important questions in case people lose interest
- Keep the survey length short
- Include options like don’t know and not applicable
- Ask open-ended questions when necessary to supplement Yes/No and close-ended questions
If possible, we also Observe users to uncover deeper and more emotionally candid problems. Sometimes user interviews aren’t able to tell you the whole story, since what users say they do might be different from what they actually do. So by using observation methods, you’ll be able to see their interactions, expressions, emotions, and other things that they might not know how to explicitly tell you during an interview.
Almost as important as conducting the discovery is the act of distilling results. Our goal is to go beyond the simple capture of functional requirements and to create a shared vision among users and stakeholders alike. We’ve found artifacts profoundly useful for not only brainstorming solutions, eliciting feedback, and enabling continuous learning, but also for empowering other stakeholders (perhaps they were not able to be as involved in the discovery process) to empathize with business users’ needs and pain points.
Persona cards and task analysis are helpful for synthesizing interview notes, while empathy maps and user journey maps can more effectively capture observational data:
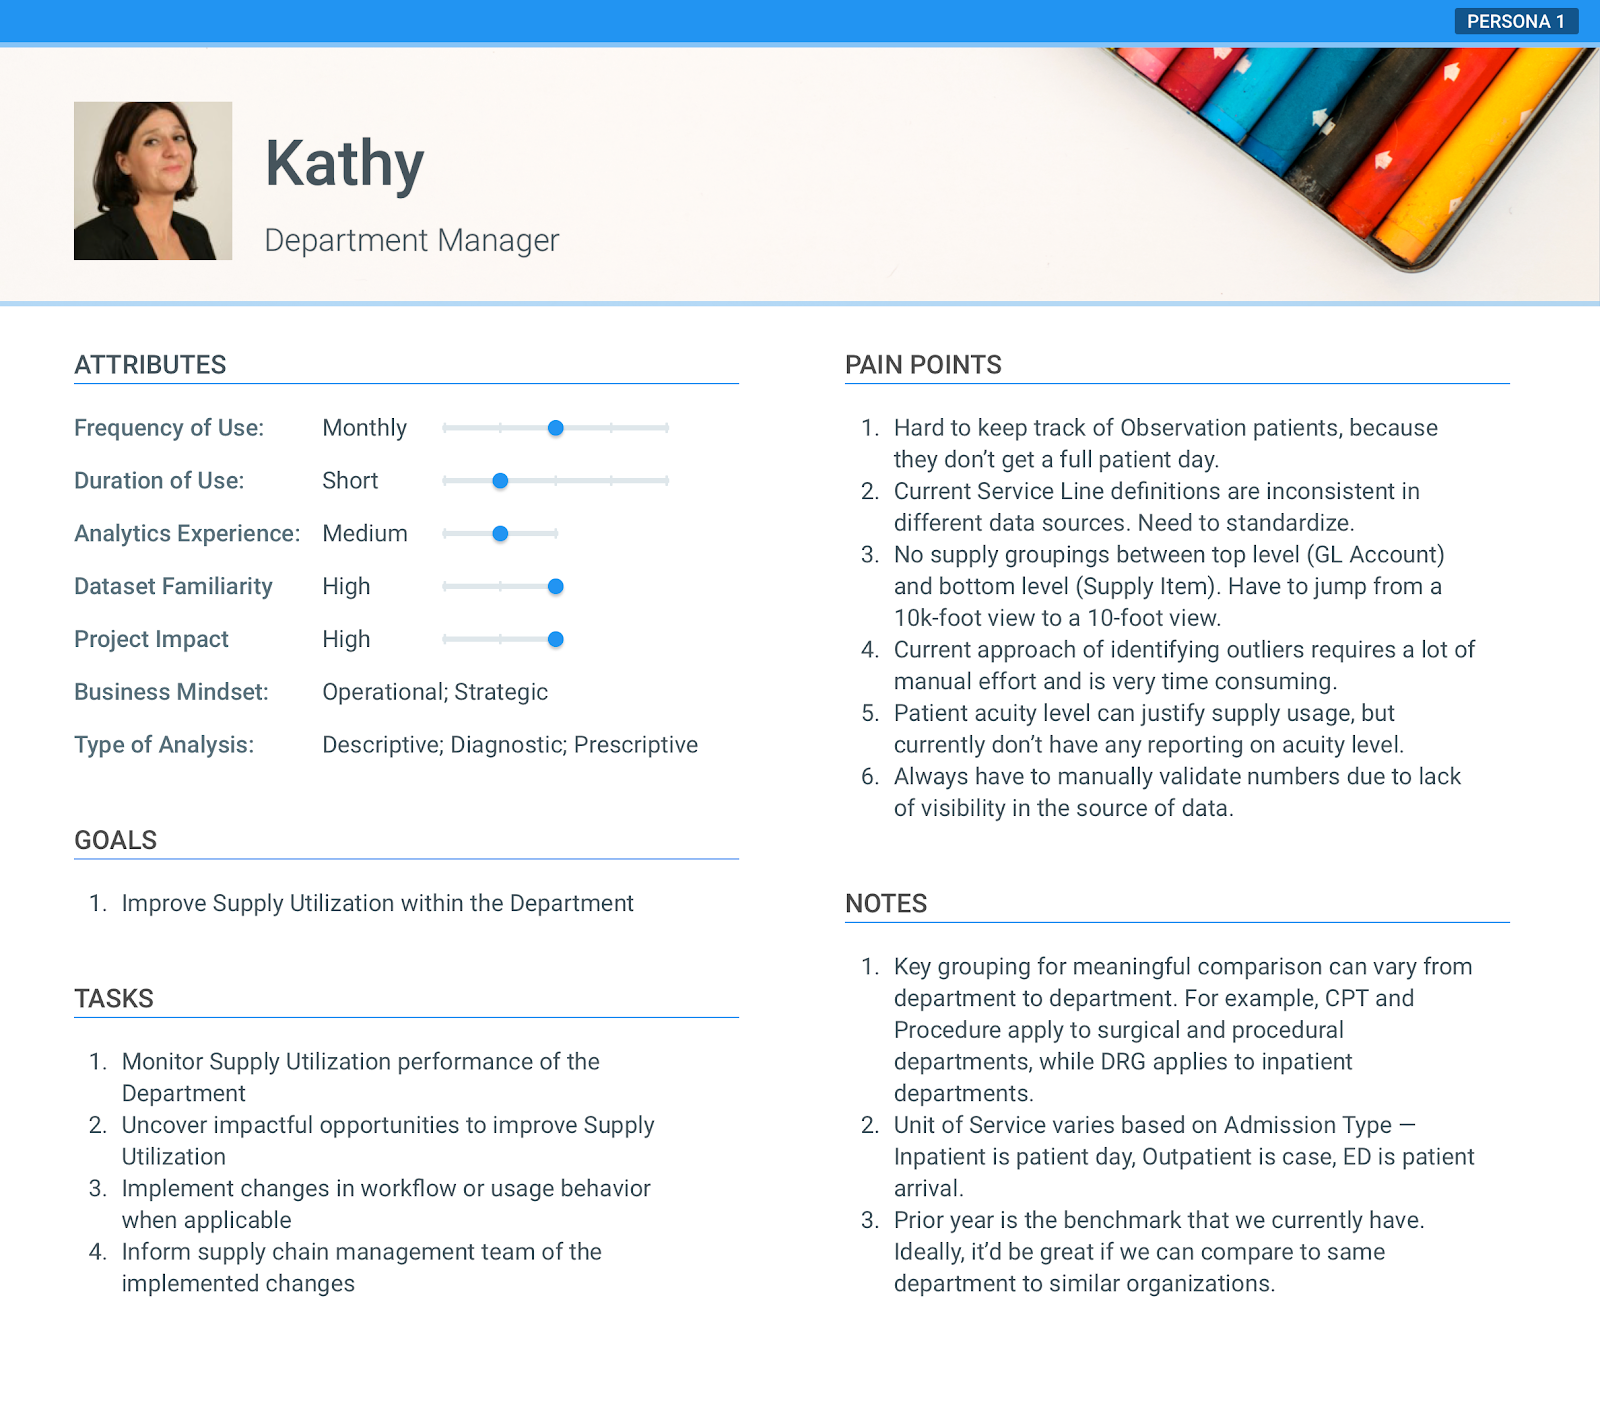
An example of our persona cards
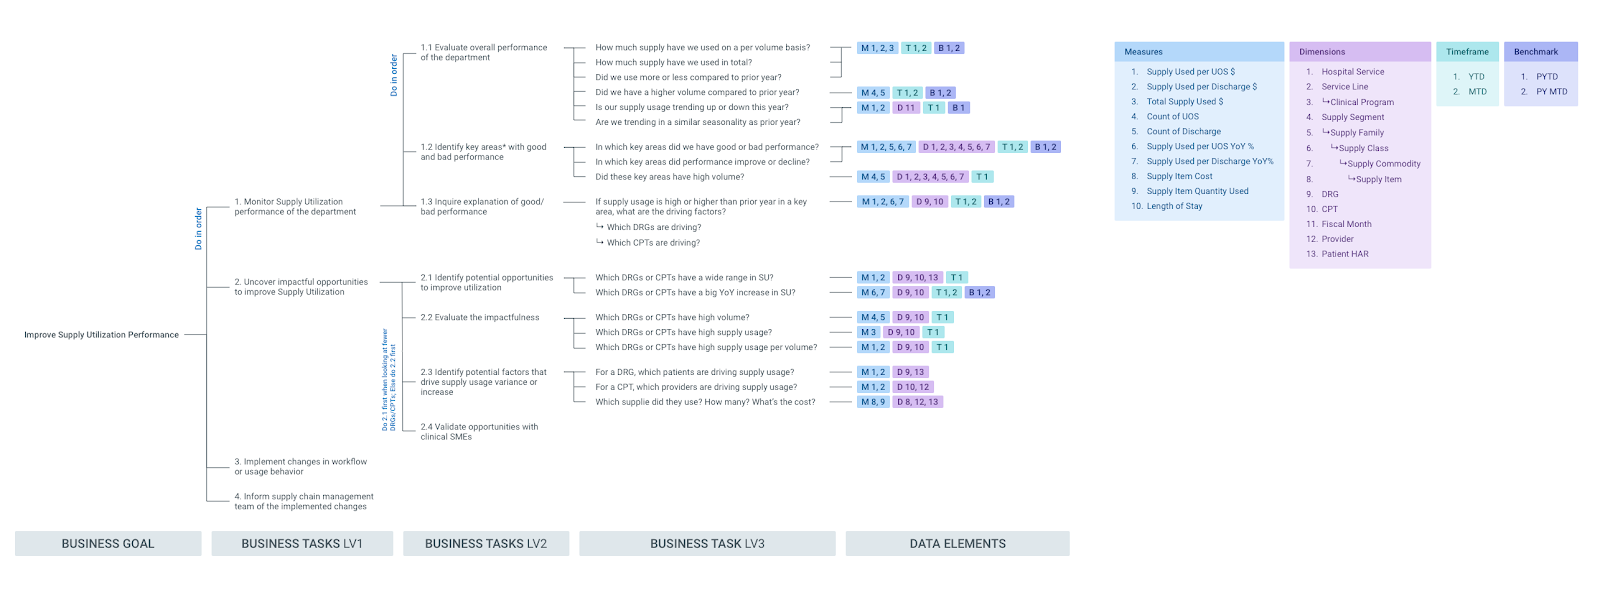
An example of a task analysis
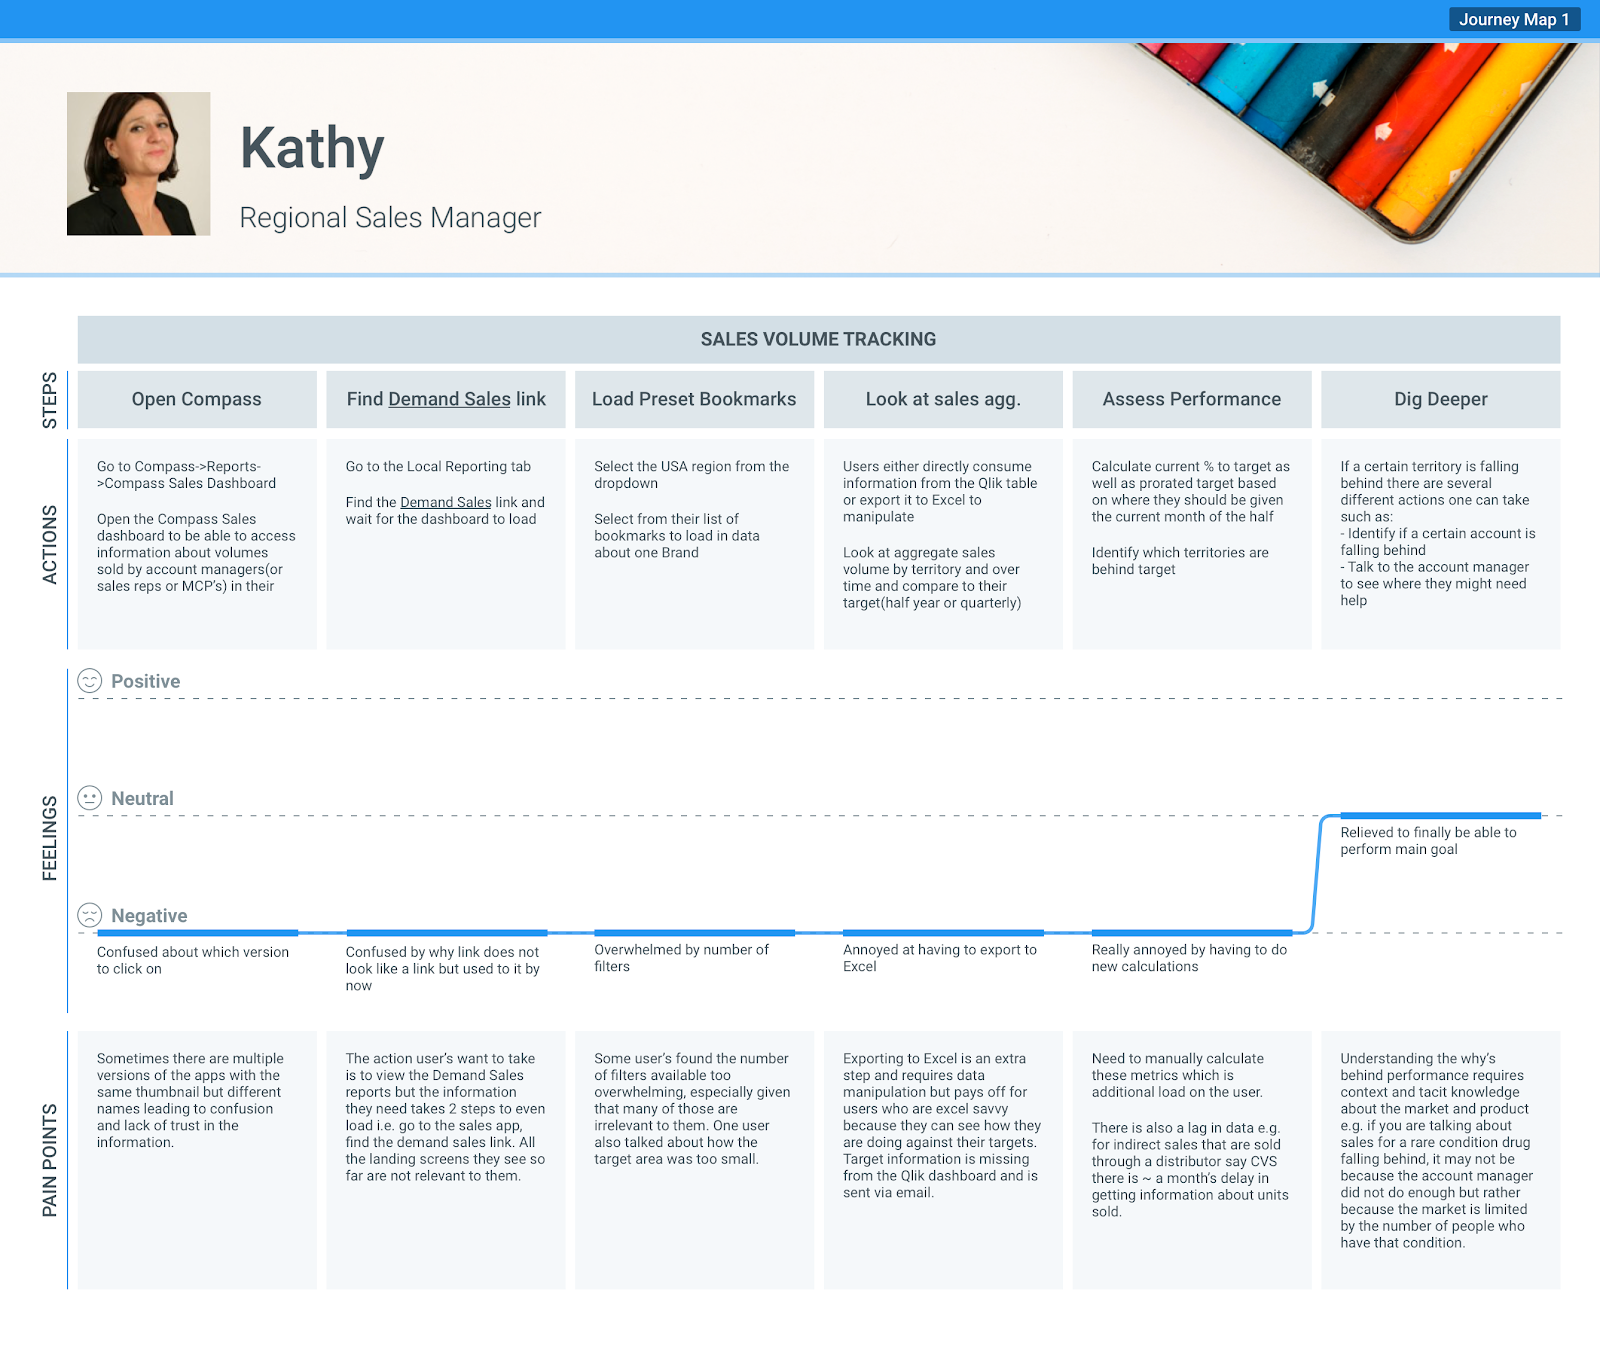
An example of our user journey maps
So, will this work with the data?
Knowing what the business and users are saying still isn’t enough without an understanding of the data. While you’d certainly be able to design a dashboard that is insightful and actionable, it simply might not be viablebecause of the feasibility and availability of the data. Gaining familiarity with the data will also help designers better translate user needs to data-speak for developers. Our process combines the user-focused design process with the BEAM framework, which is an Agile methodology used to gather Business Intelligence data requirements through the lens of the business activities that need to be measured.
By merging these two methodologies, designers and developers are able to collaboratively do research in conjunction. Developers will lead data-oriented interviews and modelstorming sessions, then cross-reference information with the designer’s user-oriented findings, so that the team can start prioritizing and planning based on what is needed/wanted/desired on the user side and what is available/possible/out-of-scope on the data side.
When are we done researching?
The research phase is, of course, foundational. It lays the groundwork for future design decisions, informs the architecture, flow, content, and depth of an application, and is directly correlated with higher actionability. We know how important this phase is, so it can oftentimes feel like we’re moving on too quickly.
Our advice is to keep track of those unanswered questions and assumptions, and to evaluate the risk of leaving them as is (how much will it impact us if we find out this assumption was wrong?) In an ideal iterative design process, you’ll be able to correct a design through evaluation and testing methods, and revisit assumptions through a later research phase.
So we’ll leave you with this little nugget of wisdom: Every piece and set of data has a human story behind it. And these stories are critical in the process of creating sustainable, empowering, and impactful solutions.
Thanks to the Axis Design team — Manasvi Lalwani, Liza George, and Gen Ellsworth — for contributing to this post, and for sharing long and philosophical discussions on the role of Research and the impact of various Define methods. To learn more about the different methods we use in our design process, view our (ever-growing) Github page.
The Contributors:

Jessie Lian is a UX designer at Axis Group, she has a background in information management and business. She has a passion for understanding people, a fascination with info viz, and an obsession with color palettes. You can often find her celebrating & contemplating in the great outdoors.