

My experience both learning and teaching about link tables is that it is hard to explain why they are what they are. You often end up resorting to: "Just follow this formula to build the link table, and you're good." And then people are afraid to modify them once they exist.
So, let's walk through the logical steps you might take to arrive at a Qlik-style link table as the solution to a data modeling challenge. My goal is to explain the why of link tables better than I have seen before, and hopefully make you more comfortable using them. When to use link tables compared to concatenated fact tables or other approaches is a conversation for another post...
Evolution of a Data Model
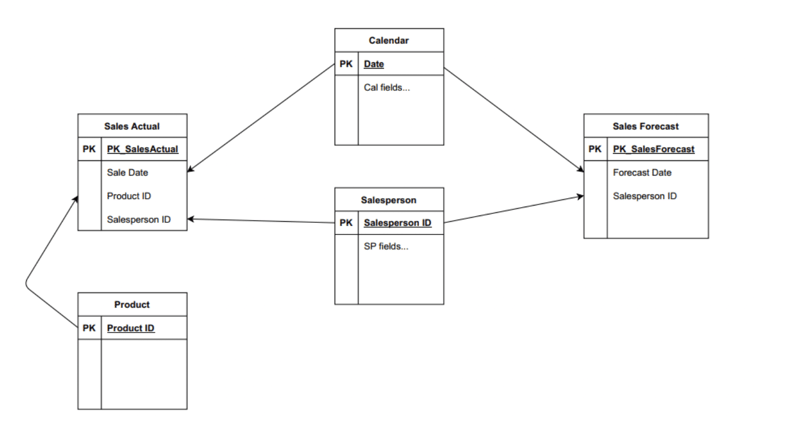
Figure 1: Two fact tables with shared dimensions: creates circular references in data model
This is the scenario that sets people down the path of BI platform-specific data modeling in Qlik. Just loading fact tables with multiple shared dimensions results in a circular reference, with more than one path to get from one table to another. I am assuming in this case that the solution requires a shared date dimension, to compare actual to forecast over time.
Qlik treats this as a faulty direct relationship between two fact tables and creates a synthetic table, so I am drawing it as you would expect to see it in an ER diagram (which would not try to relate facts directly to facts).
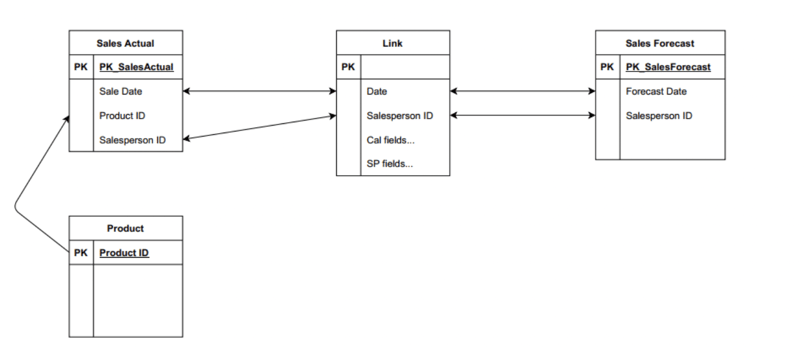
Figure 2: Outer join shared dimensions into one table: resolves loops, but creates composite keys between facts and new table
If multiple shared dimensions create multiple paths between the tables, what if we outer join them into one super-dimension to leave just one path between the tables?
This addresses the circular reference, but now we have a composite key between our fact tables and the super-dimension. Most BI platforms prefer if not require single-field relationships between tables at the presentation layer.
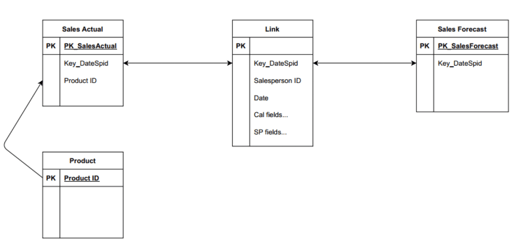
Figure 3: Concatenate keys: resolves composite/synthetic keys (highly denormalized, but maybe okay)
By trading out the composite key for a single concatenated key in both the fact tables and the super-dimension -- let's just call it a link table now -- we now have the simple relationships BI platforms like.
Looking at the structure, one possible optimization remains: the link table is highly denormalized. It is likely to have a lot of rows and a lot of columns, with a greater overall footprint than the separate dimensions that were used to create it (especially when more than two dimensions are combined). This may be okay, or it may benefit from normalizing. Let's assume the latter and move to the next step.
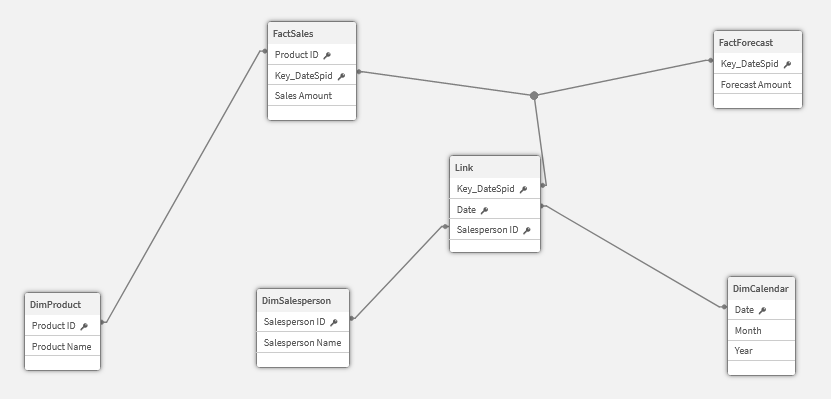
Figure 4: Normalize original dimensions from link table: now you have the typical link table data model
This should look familiar to Qlik data modelers now. The link table is the hub with relationships between fact and shared dimension tables.
Migrating from Qlik or Tableau to Power BI / Fabric?
Don’t start from scratch. Vortex automates up to 70% of the work—cutting costs, time, and risk.
See how Vortex can simplify your migration →
Some Refinement Building the Link Table
Conceptually, that is how you can logic your way into designing a Qlik-style link table, although it's not how I recommend building it. The downside of full outer joining the dimensions without a common key (AKA cross-joining or creating a Cartesian product) is that the link table is likely to contain many rows with combinations of dimension values that never occur in the fact data and thus are not needed for the data model to work. You can reduce the row count and link table size by doing a distinct union of the key field combinations from the fact tables.
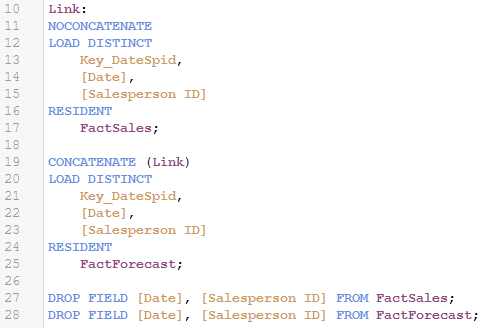
In Qlik, if you have these fields ready to go in QVDs, use those (DISTINCT does not deoptimize QVD loads), else resident load the fact tables, as shown here. Both examples assume you have already built the concatenated key in the fact tables.
If your data model is simple enough to support it, an ultra-efficient way to generate a link table is to leverage the same trick we use to create distinct lists of resident field values, with SubField to parse out the components of the concatenated key. This one load addresses the values from both fact tables.
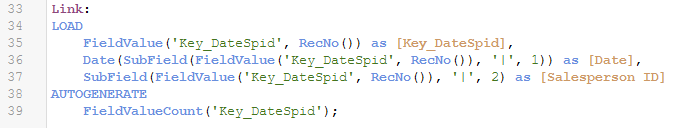
And don't forget to AutoNumber concatenated keys when you're done.
Note for Tableau Data Modelers
Link tables, like concatenated fact tables, are usually thought of as Qlik-specific constructs (unless you have read The Unified Star Schema). I'd guess most Tableau developers have never heard of them. However, with the introduction of Tableau Relationships and lack of support for fact tables with multiple shared dimensions, Tableau now describes the same constructs as potential solutions for Tableau data modelers, as well:
["Unsupported Models" section]
- Multiple fact tables related to multiple shared dimension tables. In some use cases it is common to have multiple fact tables related to multiple shared dimension tables. For example, you might have two fact tables, Store Sales and Internet Sales, related to two common dimension tables, Date and Customer. Typically, such scenarios would require creating a circular relationship in your data model. Circular relationships are not supported in 2020.2.
- You can approximate this type of model by merging some of the tables in the physical layer. For example, you might be able to union Store Sales and Internet Sales into a single table [concatenated fact table], which can then be related to Date and Customer. Alternatively, you might be able to cross-join Date and Customer to create a single dimension table [link table] which can then be related to Store Sales and Internet Sales.
So, it's up to you whether you combine the fact tables that have shared dimensions (concatenated fact table) or combine the shared dimensions themselves (link table), but both are viable solutions for generating a variety of answers using just one Tableau data source with multiple fact tables.
This blog was originally published on michaelsteedle.com.
About the Author

Mike Steedle has more than 15 years of experience in BI tool design, data modeling, ETL, data visualization, and business analysis. He is the author of best practices and frameworks used for deployments across multiple BI platforms. In addition, Mike is a Qlik Luminary, a recognition awarded to thought leaders in the analytics space. Mike also has architecture and hands-on expertise with Power BI, Qlik, Tableau, and ThoughtSpot.
With 25 years of experience, Axis Group delivers innovative data and analytics solutions and services to enterprise organizations. Axis Group meets companies on their digital transformation journeys to improve digital literacy and data fluency. Focusing on each company’s unique culture and digital maturity, Axis Group drives analytics adoption to enable self-sufficiency resulting in smarter teams and better business outcomes. Axis Group combines business acumen, leadership, and industry-specific experience with technical expertise to tackle the toughest data problems. Axis Group is The Enablement CompanyTM.