
This is the first of a series of analytics and data science related posts I will write related to data science and analytics in business. In practice we (at Axis Group) see numerous managers and decision makers eager to leverage data to derive efficiency and competitive advantage but sometimes without a clear understanding of the processes, tools, technical skills, or organizational capabilities required to do so efficiently. Hopefully my posts will be able to shed light on some aspects, both technical and nontechnical, in an easily digestible fashion that will make data science more approachable to managers, business users, and pretty much anyone interested in using data to supplement the decision making process.

In this post, I’m going to review the three most common “categories” of business analytics. This is a general overview of the main analysis objectives and problem considerations that a manager can use to help choose one approach over another. We see business analytics problems largely falling within the realm of three classes of analytics: Descriptive Analytics, Predictive Analytics, and Prescriptive analytics. This is not a new assertion, nor is it even one that we have conceived, however in our experience it largely remains true. In our work, we’ve seen a lot of confusion regarding the pros and cons and uses of each branch, so let’s go in depth to discover what their differences are and the flavors of each.
Descriptive Analytics
Descriptive Analytics usually comes in two main varieties– what we call Exploratory Descriptive Analytics and Focused Descriptive Analytics. In both cases, the data being analyzed is historical in nature, and in both cases visuals (plots, charts, graphs, etc.) are highly valuable.
Exploratory Descriptive Analytics involves a preliminary exploration of a data set prior to more rigorous analyses. This can be thought of as data profiling, where you look at things like univariate and bivariate statistics (e.g. is demand normally distributed? Are there correlations between sales and weather patterns? Etc.). Here you uncover data consistency and formatting issues and perform statistical tests to determine which variables seem most closely related and which are non informative. Exploratory Descriptive Analytics is usually meant to give you insight into the variations, relationships, and patterns in your data that can inform subsequent analyses – though the insights gained can also be used immediately to inform better decision making.
Focused Descriptive Analytics is aimed at answering specific business questions. What were sales last quarter? What was the shortage of product X last year? How are the sales representatives performing across regions? These are all focused questions with specific answers that can be found by looking at historical data. These are your SQL queries of the last several decades – though the advent of BI solutions like Qlik now allows those queries to be performed interactively through Dashboards without the need to type static SQL queries.
The only thing that descriptive analytics requires is data (and a tool to analyze it). Because you are simply looking at your historical data, you are almost guaranteed to gain some value here. At the very least you will have a better understanding of your business processes which should inform better decision making. One primary limitation of descriptive analytics, however, is that it is usually only capable of studying relationships between 2 or 3 variables at a time. If a problem has numerous interactions among the variables (which is common in practice) it becomes difficult to analyze the data in a holistic manner using descriptive analytics alone.
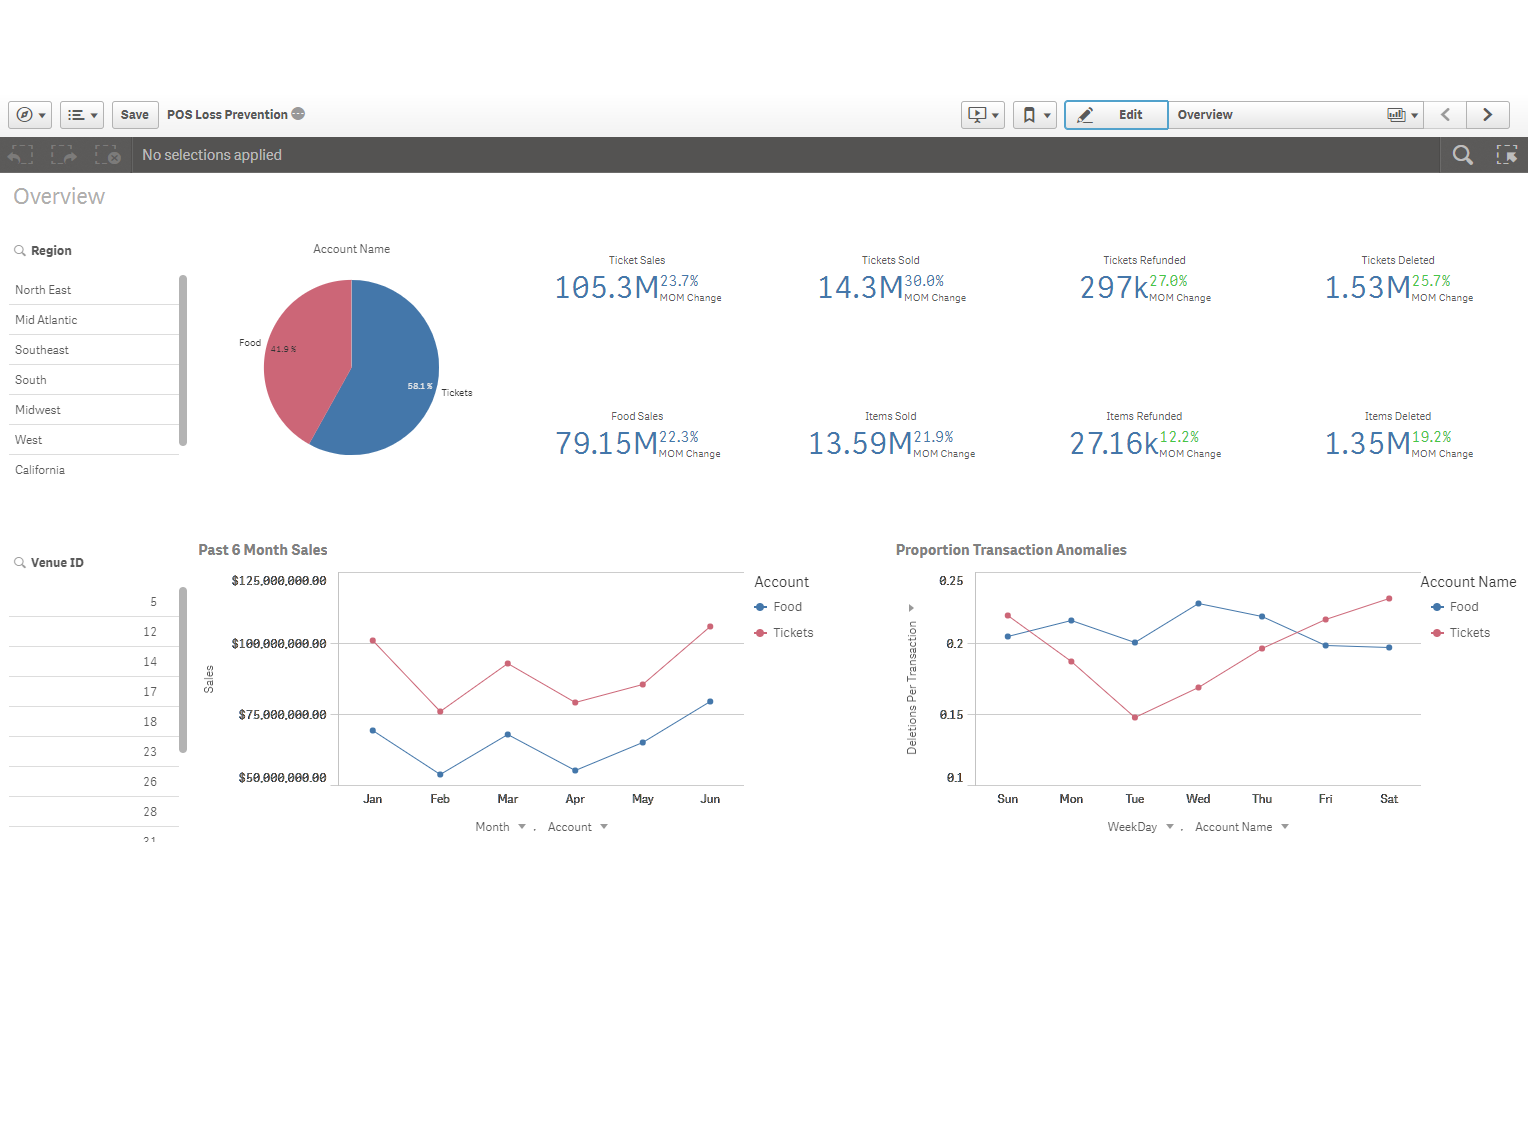
Below: A BI Dashboard in the Qlik Sense platform that blurs the line between Focused and Exploratory Descriptive Analytics.
Predictive Analytics
While descriptive analytics is focused on an analysis of the past, predictive analytics seeks to leverage the same historical data to build mathematical models that can be used to make inferences about what will happen in a future (yet unrealized) scenario. A simple example might be: "Given the behavior of my past customers, how likely is a particular new customer to buy my product if I send him/her a promotional coupon?”. The question itself acknowledges that there may be patterns within past data that can be used to make better decisions when interacting with future customers. Within Predictive Analytics, we most commonly see two sub classes: Explanatory Predictive models and Purely Predictive models, both of which are discussed below. It is the eventual model’s use that decides whether Explanatory Models or Purely Predictive models should be employed.
Explanatory Predictive Models are models for which the mathematical model itself, rather than just its output, is important. That is, how do the inputs to the model relate to the output? This is most often the case when managers want to study the relationship between the business levers under their control and some target metric or KPI. The main business objective is usually to know how changing the inputs via those levers will affect an outcome. CAUTION! While it is simple to build a model that quantifies a relationship between an input and an output, it is very difficult to show that the relationship is causal (i.e. that changing the input will change the output). Controlled experimentation and A/B testing are typically required to investigate causal relationships. Subject matter expertise and business acumen are required to carefully build and interpret the results of an explanatory predictive model. Without sufficient care, misinterpretation of model results could lead to decisions that are counterproductive to your goals.
Purely Predictive Models on the other hand should be employed when stakeholders care only about the model output. The more accurate that prediction, the better, regardless of what data goes into the model. For example, if you are trying to predict spot prices on oil to manage the risk of your cost fluctuations – you will likely use any and all data sources available that improve the predictions of the model. At the end of the day, you need the best prediction possible to inform the risk management and decision making process. The so called “black box” models that are difficult to interpret (but usually more accurate than more transparent techniques) are often found applied here.
While descriptive analytics guarantees some level of insight, predictive analytics carries with it more risk. Because no two problems and data sets are alike it cannot be known beforehand that a predictive analytic model will yield useful results. Certain data sets may contain low or no predictive power for a given problem. As a manager, it is up to you to use your subject matter expertise to determine whether the risks associated with a predictive analytic endeavor are worth the potential reward from a successful outcome.
Below: Decision tree model built using historical conflict data to predict whether hypothetical future conflicts in the Congo will result in fatalities. (see more details about our experience at the United Nations Hackathon here)

Prescriptive Analytics
Prescriptive analytic techniques go a step beyond predictive analytics in that the goal here is for the output of the model to inform on the best actions to achieve a goal. These are often formulated as optimization and simulation problems where a business or manager is trying to maximize (or minimize) some objective (e.g. profit, efficiency, cost, employee satisfaction, etc.) subject to a set of limitations on resources, contractual obligations, or other constraints. For example, “How do I allocate machines to my manufacturing process in order to minimize my operating costs while meeting all demand?” In this problem, the obvious goal is to minimize operating costs, under the constraints of meeting demand. There would likely be additional constraints– you only have a certain number of machines, there are setup and retooling costs, there may be constraints on available qualified personnel, and the list can go on and on. A mathematical representation of the problem can be formulated that can be used to solve for the best set of actions to maximize your goal.
Now, here’s the challenge. Not all business problems can be framed in this fashion. And, of the ones that can, technical challenges will still arise. Typically, it is difficult to identify all the interacting pieces of the problem you are looking at. Often more difficult is quantifying those pieces as inputs (costs, benefits, constraints, etc.) of the mathematical representation of the problem. Additionally, as the possible set of actions/decisions becomes large, optimization problems can become difficult to solve in a computationally efficient manner (e.g. the Travelling Salesman Problem). Now that you’ve heard about the gloom and doom of prescriptive models, here’s the (significant) upside. In a traditional business setting, decisions may be made across multiple individuals, departments, functional areas, etc. Without close coordination among those decision makers, it is near impossible to guarantee that their joint actions are all working to maximize a common goal. This is where prescriptive analytics can shine. The goal is not for any individual action to be the best, but the collection of all decisions to be the best set of decisions. It does so by leveraging data and mathematical principals in a consistent manner to maximize the benefit to the business.
Prescriptive analytics are commonly used in supply chain, routing and operations where the number or decisions are too vast for a human to efficiently manage - though they have been used effectively in many business areas.

Conclusion
In this post, we summarized the three main types of business analytics. Generally speaking, the difficulty of the modeling approaches increases in the order they were introduced (descriptive, predictive, prescriptive). In our experience, however, we have noticed the successful use of predictive and prescriptive techniques providing greater differentiation between our clients and their competition, increasing their competitive advantage. That said, no single approach, is better than the others. Truly data driven enterprises employ all techniques without bias. It’s all about the right tool for the job. The factors involved in selecting the most appropriate type of analysis will be dictated by the requirements of each particular problem. Once the approach has been identified, further effort will be required to determine the best tools and techniques for your particular use case.
Stay tuned for the next blog, where I'll begin a series called “Opening the Black Box”. It is going to be my attempt to present some commonly used algorithms in a simple, straightforward fashion to show you what is actually going on under the hood – no calculus required!
 Tim is a Data Science Consultant at Axis Group. He has in-depth knowledge of data science, machine learning, business analytics, and business intelligence. He believes that “Data Science” is too often thrown around as a buzz word and hates seeing when the methods used to solve a problem become more important than the problem itself. He is passionate about working with partners to identify the appropriate data analysis techniques – whether the use BI dashboarding, machine learning, statistical models, or any other data approach – to solve their problems efficiently, and in the context of their organizational capabilities. Tim is a two-time graduate of Georgia Tech, having earned a PhD in Civil Engineering and a MS in Analytics.