

The tool you think is for DAX experts is actually your best friend for understanding Fabric semantic models - especially the ones that never touch your desktop.
When you first open DAX Studio, you see a blank query window staring back at you, screaming "you need to be a DAX expert to use this tool." You don't.
Here's what most people miss: 80% of DAX Studio's value has nothing to do with writing or optimizing DAX queries. Instead, it's about understanding what's actually happening inside your semantic model - the structure, the memory consumption, the relationships, the hidden problems that Fabric's web interface doesn't readily display.
This matters more than ever in Fabric, where you might be building semantic models entirely in the browser, never downloading a .pbix file, never opening Power BI Desktop. You need visibility into what you've built, and DAX Studio gives it to you.
Getting Connected
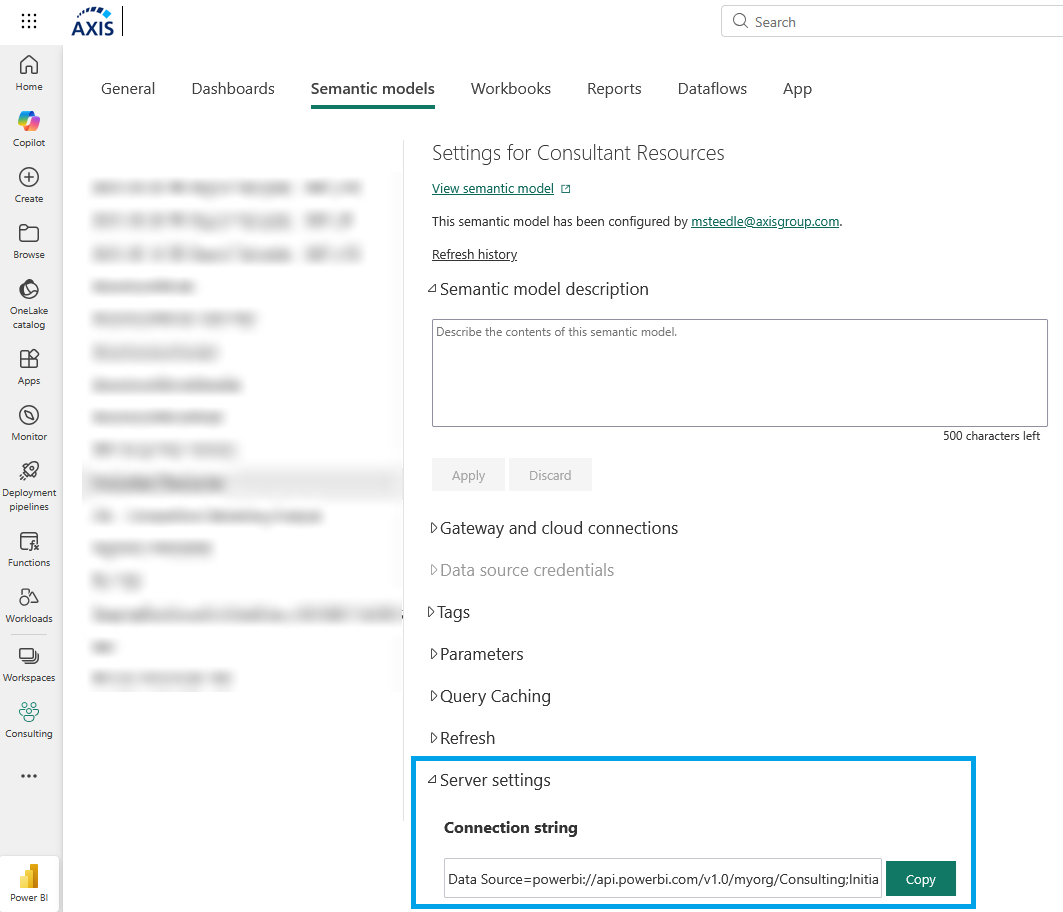
You're working in Fabric. Maybe you built your semantic model using web authoring. Maybe you inherited one that exists only in a workspace. You open the semantic model settings, and you see... not much. Basic metadata. A list of tables. But you can't see which tables are consuming the most memory, why your model is 800MB when you thought it would be 200MB, or what your actual relationship cardinalities look like.
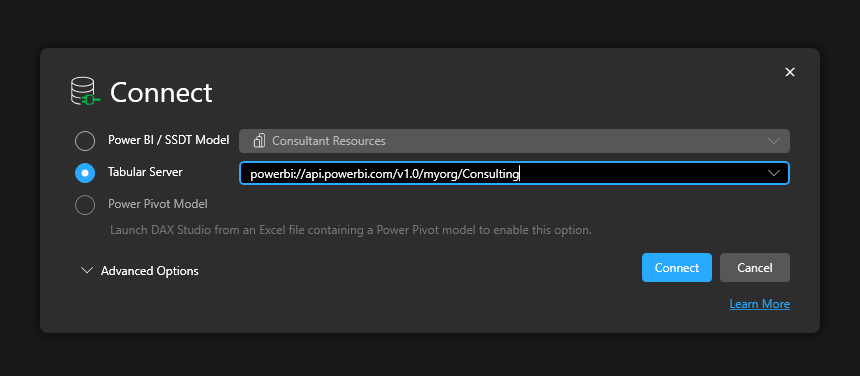
If your model lives in Fabric: Open the semantic model settings page in the Fabric portal. Go to Server Settings. Copy the connection string (starts with powerbi://api.powerbi.com/...). Open DAX Studio, select "Tabular Server," paste the connection string, click Connect.
If you're working with a local file: Open your semantic model in Power BI Desktop, click External Tools → DAX Studio. It connects automatically.
Connecting to a Fabric/Premium semantic model via XMLA requires at minimum Contributor permissions on the workspace, plus the XMLA endpoint must be enabled. Even the smallest Fabric SKU includes the XMLA endpoint!
That's it.
Your Starting Point: How Big Is This Thing?
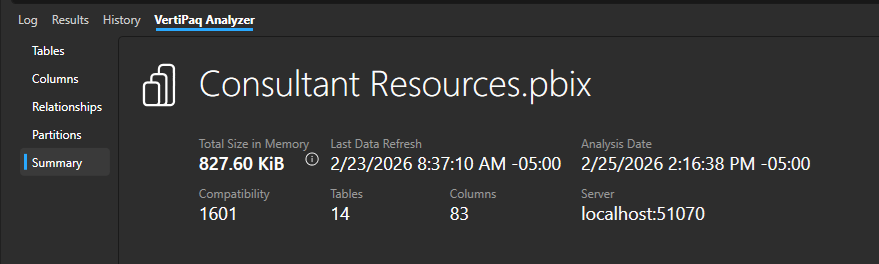
Once connected, click Advanced → View Metrics. A new tab appears at the bottom: VertiPaq Analyzer. Click it, then click the Summary view.
You now see total semantic model size in memory, plus the total number of tables and columns. Further details about these, relationships, hierarchies, and more are found on other menus of the VertiPaq Analyzer tab. Note: DirectLake semantic models will missing some information about data size.
This is your baseline. If your model is 50MB, don't spend a week optimizing it. If it's 2GB and growing, this number tells you whether your optimization work is paying off.
Finding What's Consuming Memory
Click the Tables view. Sort by Total Size (descending).
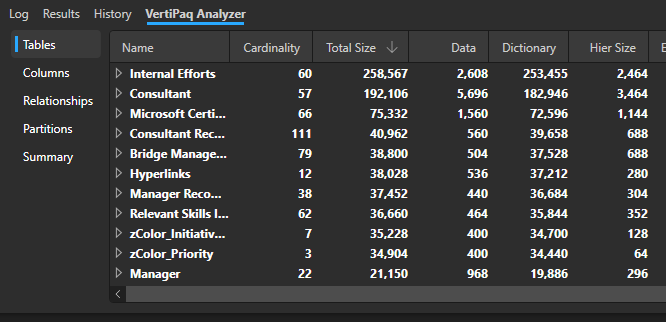
You're looking at every table ranked by memory consumption. Focus here first - the tables at the top are where optimization effort pays off.
Real scenario: You're asked to optimize a slow report. The semantic model is 1.2GB. You connect with DAX Studio, open VertiPaq Analyzer, sort tables by size.
The top table? "DimPatient" - 480MB, 40% of your entire model.
You look at the Cardinality column (that's row count): 2.5 million patients.
You go back to the business. "Do we need all 2.5 million patients, or just active patients from the last 3 years?"
"Oh, just active patients. Maybe 400,000 rows."
One filter in your data pipeline, model drops to 680MB. Ten minutes of investigation, 40% size reduction.
This is what DAX Studio does - it shows you where to look.
Drilling Into Columns
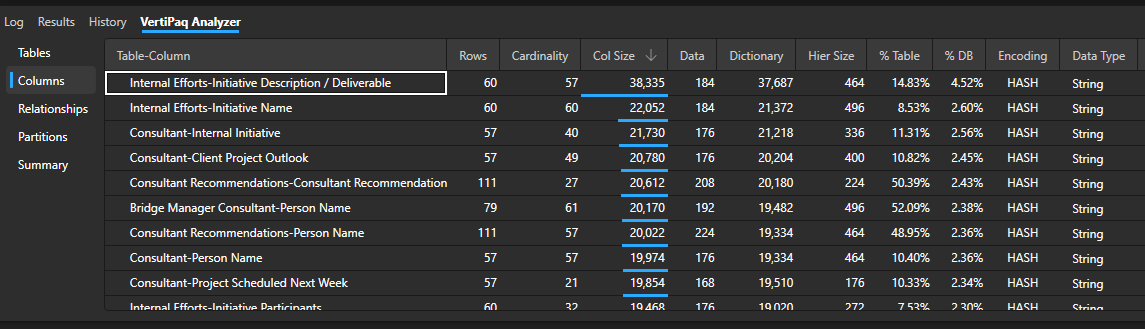
Click the Columns view. Now you see every column in your entire model, ranked by memory consumption.
Sort by Total Size. The top columns consuming memory are your optimization targets. Look for text columns with high cardinality (lots of distinct values) - these are memory killers. Common optimizations to look for: full text descriptions that should be removed, ID fields imported as text instead of integers, or address fields that should be split into City/State/Zip for better compression.
Checking Your Relationships
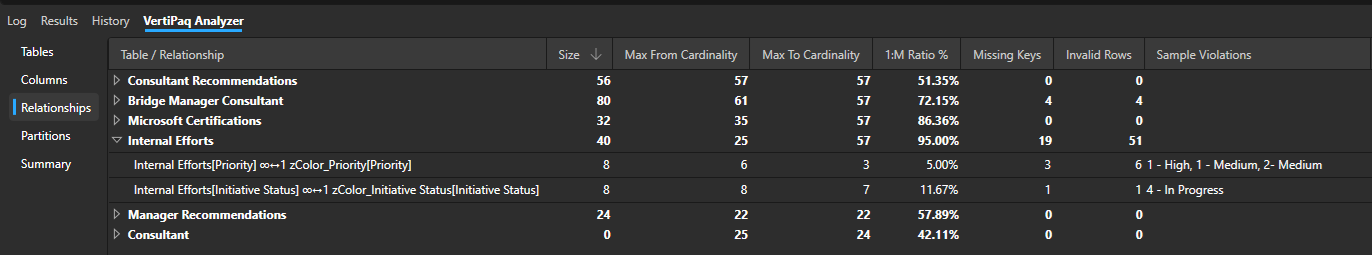
Click the Relationships view. This shows you what you thought you knew about your model, with the actual data backing it up.
Review the relationship cardinalities. You want to see "Many-to-One" for almost everything. If you see "Many-to-Many," that's a red flag for performance - every query that crosses that relationship generates multiple storage engine queries. You'll also spot data quality issues like missing reference data or orphaned fact records.
You're Not Writing DAX, You're Investigating
That blank query window is intimidating, but so far we have written zero queries.
- Connecting to Fabric semantic models without downloading them
- Seeing actual memory consumption by table and column
- Understanding relationship performance characteristics
- Finding problems Fabric's web interface doesn't show you
You don't need to be a DAX expert to get value out of DAX Studio. You need to be curious about what's actually in your model.
What's Next
Now you know how to diagnose problems. In Part 2, we'll cover how to measure whether your fixes actually worked - capturing performance baselines, benchmarking across Fabric capacities, auditing measures for consistency, and building repeatable health checks for multiple semantic models.
Because finding the problem is step one. Proving you fixed it is step two.