VP of Finance, Multinational packaging solutions provider
Meeting the Challenge
How can a company go beyond the P&L and uncover the “why” insights?
A multinational paper and packaging companies was creating P&Ls manually each month. And because financial operations managers spent much of their time creating statements, the team had little time to do any deeper trend analysis to find the real drivers of profitability.
They were certainly not lacking in information — different groups each created custom reports and spreadsheets. But actionable insights were lost in the noise.
When our client wanted an application that could finally answer the “why” questions, they called Axis Group.

Our Solution
Uncovering the hidden factors that drive profitability
Using our Solution Design Methodology, Axis conducted interviews and research to develop a design that worked. We worked closely with our client’s finance team to understand what really mattered: giving attention to what specific factors drive profitability, uncovering customers, suppliers and products that need attention now, and tracking prices and projections and comparing them to public index trends.
Axis gave executives guided analytics that let them see YTD trends and quickly compare current performance KPIs against budget, forecast or prior year.
Regional VPs, who oversees sales, performance and profitability, could focus on ways to increase sales and margins, identify leading and lagging customers and manage to budget and meet targets.
Directors responsible for driving profitability by managing sales and supply could find new ways to convert unprofitable customers, keep prices current with market indexes and track profit by SKU, supplier and customer.
Plant managers got an instant snapshot of a their plant’s performance, with screens designed to draw attention to specific areas where performance is favorable or unfavorable.
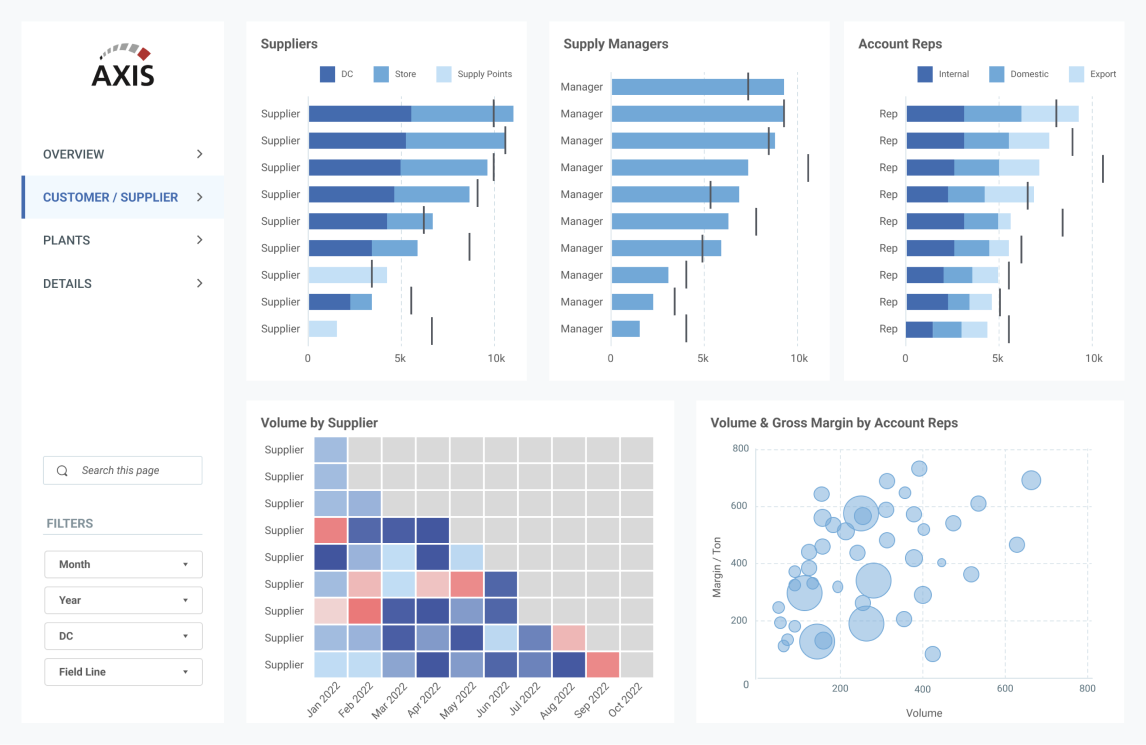
Solution Sample: The Supplier Analysis uses strategic toggles to give the user a complete picture of both suppliers and sales. The monthly heat map and scatter plot help quickly uncover trouble spots in volume and margin in different areas.