
Did you know that manufacturing accounts for 32% of total GDP? This $6.7 trillion-dollar piece of the economy is all around us in everything we do. When a piece of industry is so massive, even a modest efficiency increase of .001% could mean saving your business hundreds of thousands of dollars. To shed light on where this savings can be realized, Axis Group developed a manufacturing weekly operations dashboard. Users can pinpoint where their expected outputs are not matching up with what is being produced and locate where their man hours are producing unit quantities below expectations.
How Axis Group Helped
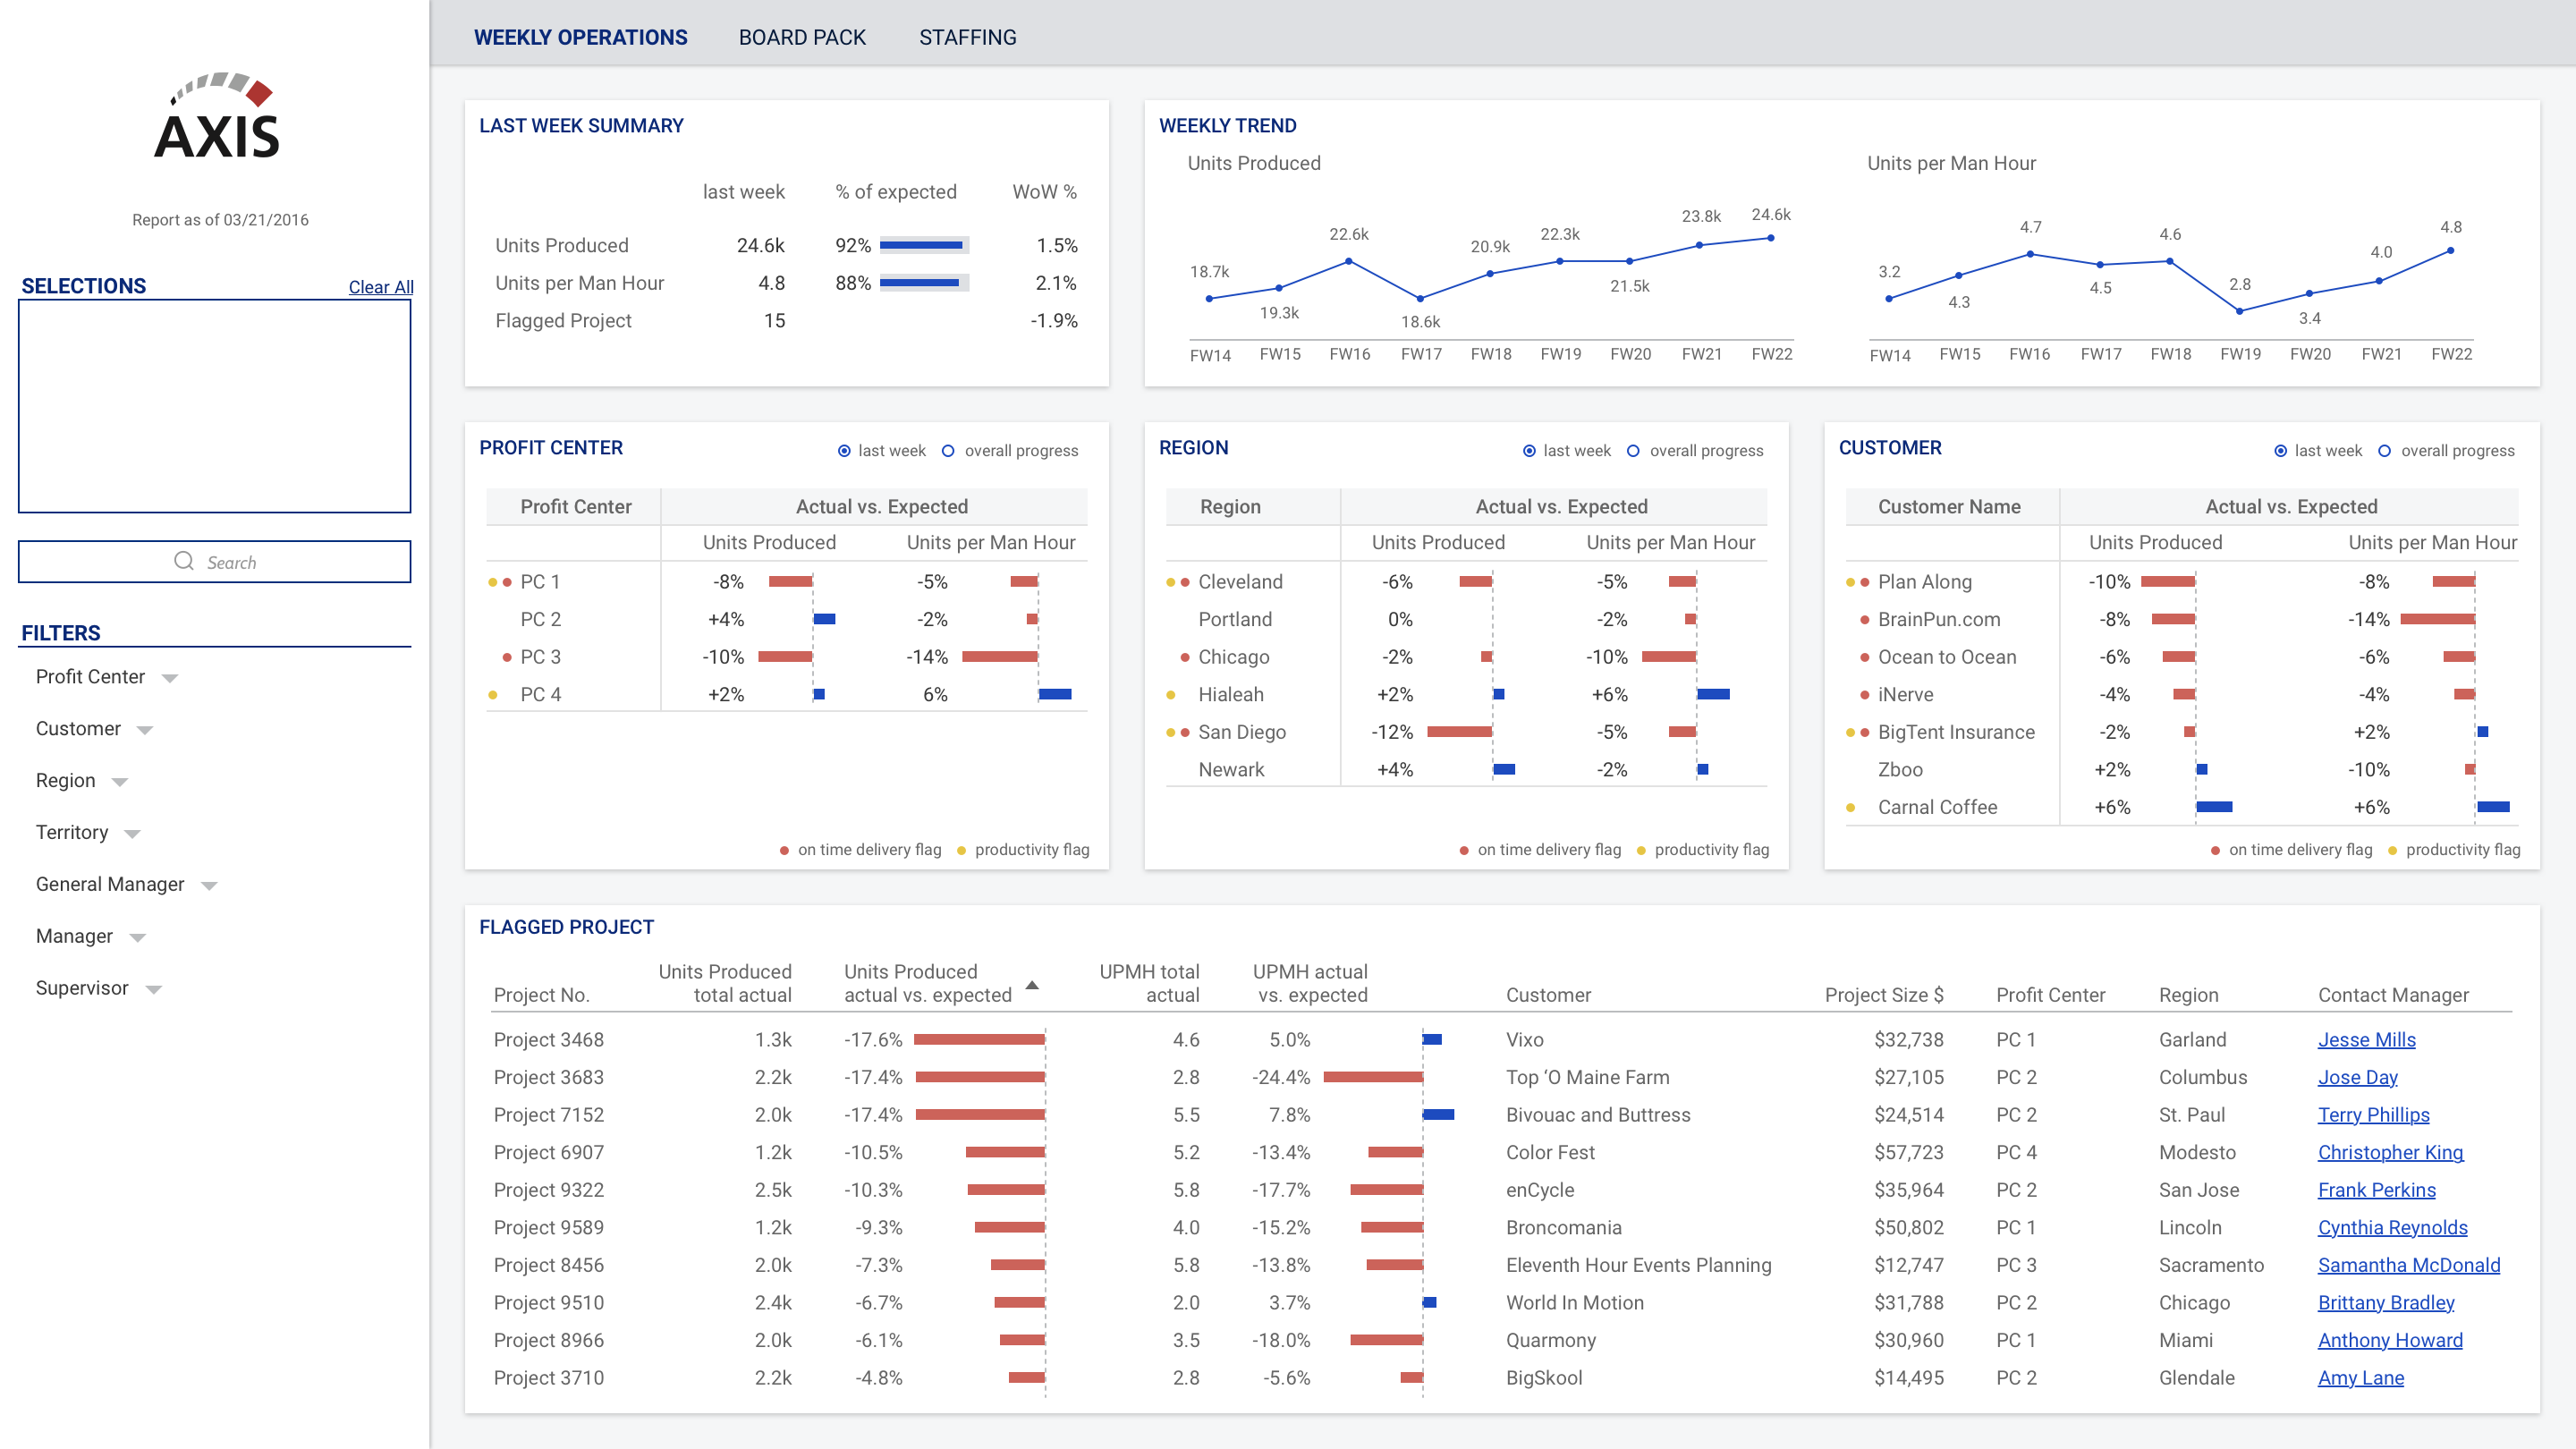
This dashboard helps the user drill down from the big picture to a project-level breakdown of production. A high-level summary of the previous week is prominently displayed at the top, along with week-over-week trends for unit production and units per man hour (UPMH). Throughout the interface we see blue to mean production or improvement, while red/yellow mean production shortfalls or declines. The user can view a production breakdown last week and overall by profit center, region, or customer to deduce where shortfalls are the most severe. As the user story develops, the user can see a breakdown at the most granular level to pinpoint which specific projects need their attention.
Summarized Points:
- Dashboard transitions user story from high-level KPIs to project-level details.
- Week-over-week trends are included in multiple locations to help the user identify positive/negative changes.
- Red/yellow are used whenever negative trends or missed targets occur. Blue is used to show total production, exceeded targets, and improvements.
- Filters on the left banner let the user customize this top-to-bottom story for any given scenario.
The Contributors:
 Gen is our in-house pixel-perfect precision master. While enjoying strategic and analytical thinking, he also pays attention to every detail. He is a UX Designer at Axis Group who received his Masters Degree in Industrial Design from the Georgia Institute of Technology.
 Philip Rembert is an Industrial Engineer from Georgia Tech. He began his career in a rotational program working in Atlanta. After learning several positions, he discovered Business Intelligence and has happily stuck with it since. He enjoys helping others solve problems and discovering the stories behind data. When he isn’t working with data, he is an avid board game and card game player.
The International Trade Administration "LOGISTICS AND TRANSPORTATION SPOTLIGHT: The Logistics and Transportation Industry in the United States", https://www.selectusa.gov/logistics-and-transportation-industry-united-states. Accessed 12 February 2018.
Yamanouchi, Kelly. The Atlantic Journal Constitution. "Airport outage: Delta CEO to seek repayment for lost revenue", http://www.ajc.com/business/airport-outage-delta-ceo-seek-repayment-for-lost-revenue/VFPAnVlsk4dXQVTlYaI33I/. Accessed 12 February 2018.